Demo Video
Real-Time Sales Analytics ML Forecasting Dashboard
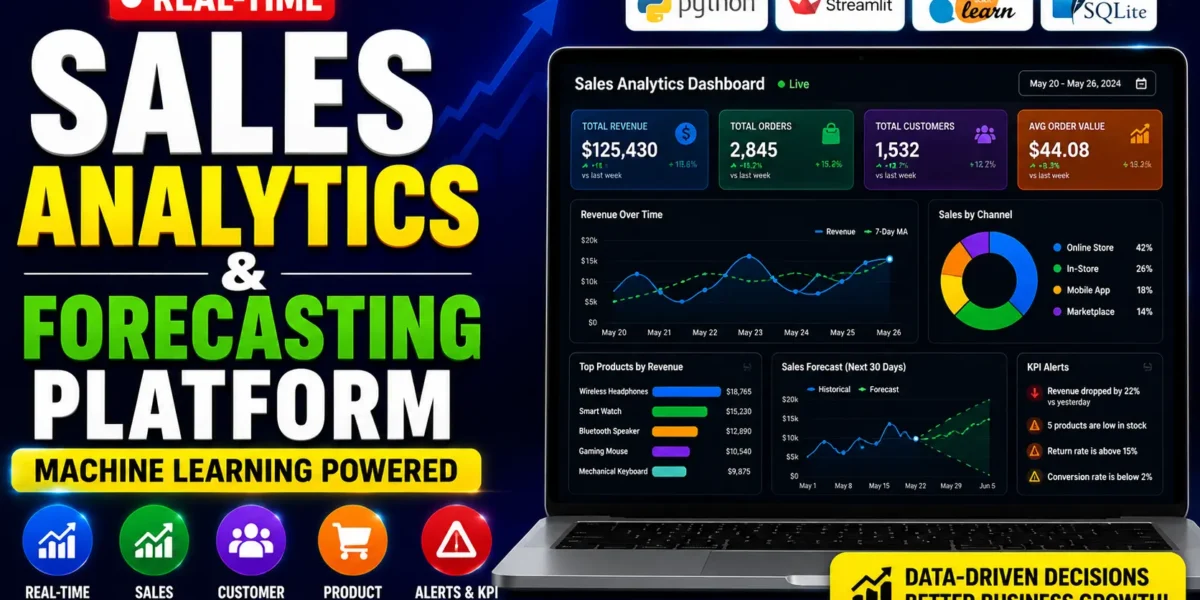
SalesIQ is a real-time sales analytics and ML forecasting dashboard built with Python and Streamlit. It auto-seeds a SQLite database with over 5,000 sales records, 500 customers and 50 products, then turns that data into live business insights. Key features include a real-time KPI dashboard, revenue forecasting with Random Forest, Gradient Boosting and Ridge Regression, RFM plus KMeans customer segmentation, a cosine-similarity product recommendation engine, inventory and demand prediction, automated KPI alerts, and bcrypt-secured role-based login. Ideal for BCA, MCA, B.Tech and MBA IT final year students. Includes source code, report, synopsis and PPT.
What You Will Get
The Real-Time Sales Analytics & ML Forecasting Dashboard (SalesIQ) is a complete, deployable Python web application built with Streamlit, not a notebook or a demo. On first launch it automatically creates a local SQLite database and seeds it with over 5,000 realistic sales records, 500 customers, 50 products across 8 categories, and two years of transaction history. It ships with a bcrypt-secured login system supporting Admin and Manager roles, a dark-themed dashboard, and six fully built feature modules powered by real machine learning models. The whole project runs offline on any laptop in about five minutes.
Key Features
- The real-time KPI dashboard tracks revenue, order counts, unique customers, and average order value with period-over-period percentage change.
- Sales forecasting predicts future daily revenue using three switchable models: Random Forest, Gradient Boosting, and Ridge Regression.
- Feature engineering includes lag features at 7, 14, 21 and 28 days, rolling mean and standard deviation, and calendar features such as day of week and weekend flags.
- Customer segmentation combines industry-standard RFM analysis with KMeans clustering to label customers as Champions, Loyal, At Risk, or Lost.
- The product recommendation engine uses item-item collaborative filtering with cosine similarity on a customer-product purchase matrix.
- Inventory monitoring tracks stock across all 50 products, flags low and out-of-stock items, and predicts demand for the next 7 to 30 days.
- Automated KPI alerts monitor five thresholds including revenue drops, low stock, high return rate, and low conversion rate, with severity levels and one-click resolution.
- Interactive Plotly charts provide hover, zoom, dual axes, donut charts, scatter plots, and confidence bands.
- Role-based access control with bcrypt password hashing gives Admins a panel to manage users, view table row counts, and clear resolved alerts.
Technology Stack
| Component | Technology |
| Web UI | Streamlit 1.58 |
| Database | SQLite (8 tables) |
| Machine Learning | scikit-learn (Random Forest, Gradient Boosting, Ridge, KMeans, PCA) |
| Data Processing | pandas, numpy |
| Charts | Plotly |
| Authentication | bcrypt password hashing |
| Data Generation | Faker |
| Language | Python 3.9 to 3.13 |
System Requirements
- Python 3.9 to 3.13 (3.10 or 3.11 recommended for the smoothest install).
- Streamlit 1.58 for the dashboard and page routing.
- pandas, numpy, and scikit-learn for data processing and machine learning.
- Plotly for interactive charts and visualisations.
- bcrypt for password hashing and Faker for synthetic data generation.
- python-dateutil for date handling.
- SQLite, which is bundled with Python, so no separate database server is needed.
- Any modern browser and around 500 MB of free disk space.
How It Works
On the first run the setup script creates all eight SQLite tables and seeds them with two years of synthetic sales history generated by Faker and NumPy, a process that takes only a few seconds. A user logs in through the bcrypt-backed authentication gate, and Streamlit routes them to the dashboard modules their role allows. Each module pulls live data from SQLite, trains or applies its machine learning model, and renders the result as an interactive Plotly chart. The alerts module runs threshold checks against current KPIs and writes any new critical or warning alerts back to the database with timestamps.
Perfect For
This project fits BCA, MCA, B.Tech CSE, B.Tech IT, B.Sc Data Science, and MBA IT students who need a final year project that goes well beyond a single notebook. It covers databases, machine learning, web development, authentication, and business analytics in one codebase, making it strong material for viva questions and project defence. It also works as a portfolio and interview project for job seekers who want to show recruiters production-quality work rather than a Jupyter file.
Future Enhancements
The project can be extended with deployment to Streamlit Community Cloud, integration with a live sales API or a MySQL/PostgreSQL backend, deep learning models such as LSTM or Prophet for time-series forecasting, email and WhatsApp alert notifications, exportable PDF and Excel reports, multi-store or multi-branch support, and a customer churn prediction module.
Watch Project Demo
Watch the full project walkthrough and setup tutorial on our YouTube channel.
▶ Watch on YouTube – Decode It
More Details & Full Documentation
For complete project details, source code, and setup guide, visit the official project page.
Project Modules
- bcrypt hashed login system
- Session state management
- Role-based access control (Admin / Manager)
Admin Panel:
- View all registered users
- Create new user accounts with hashed passwords
- Check row counts for all 8 database tables
- Delete resolved alerts
Dashboard Module:
- Live revenue, order count, unique customers, average order value
- Period-over-period percentage change on every KPI
- Daily revenue trend with 7-day moving average
- Category-wise revenue donut chart and sales by channel
- Top 10 products by revenue and dual-axis conversion rate chart
Forecasting Module:
- Revenue prediction with Random Forest, Gradient Boosting and Ridge Regression
- Lag features (7, 14, 21, 28 days) and rolling mean / standard deviation
- Calendar features: day of week, month, is_weekend
- Forecast chart with confidence band and forecast table
- Model accuracy metrics (MAE, RMSE, R2) and feature importance chart
Segmentation Module:
- RFM scoring (Recency, Frequency, Monetary) for 500 customers
- KMeans clustering with automatic segment labels
- PCA-based 2D cluster scatter plot
- Revenue by segment chart and RFM score distribution histograms
Recommendation Module:
- Item-item collaborative filtering using cosine similarity
- Customer-product purchase matrix
- Top-N product recommendations per customer
- Similar product lookup for any selected product
Inventory Module:
- Real-time stock levels across all 50 products
- Low stock and out-of-stock automatic flagging
- Demand forecast with a global Random Forest model (7 to 30 days)
- Stock coverage days based on predicted demand
Alerts Module:
- Revenue drop above 20% versus previous day
- Stock below 10 units and out-of-stock detection
- Return rate above 15% and conversion rate below 2%
- Severity levels (critical / warning) with timestamps
- One-click alert resolution stored in the database
Installation Guide
1. Download and extract the ZIP file
2. Open a terminal inside the project folder
3. Create a virtual environment: python -m venv venv
   Windows: venv\Scripts\activate
   macOS / Linux: source venv/bin/activate
4. Install libraries:
   pip install --prefer-binary streamlit pandas numpy scikit-learn plotly faker bcrypt python-dateutil
5. Run the app: streamlit run app.py
6. Open the localhost URL shown in the terminal
7. Login with the default credentials:
   Admin - username: admin / password: admin123
   Manager - username: manager / password: manager123

Note: On first run the app seeds the SQLite database automatically.
This takes about 5-10 seconds and happens only once.
FAQ for this project coming soon.
No reviews yet. Be the first to review!
Write a Review
Related Projects
 35% OFF
Featured
35% OFF
Featured
 50% OFF
Featured
50% OFF
Featured
 23% OFF
Featured
23% OFF
Featured
 40% OFF
Featured
40% OFF
Featured